










Housing mix
Clovis, CA housing supply, ownership, and rent
What the latest ACS housing mix can and cannot tell buyers and renters comparing options in Clovis, CA.
Source: U.S. Census Bureau

Last updated . Article facts reviewed through this date. Time-sensitive figures show their own as-of dates.
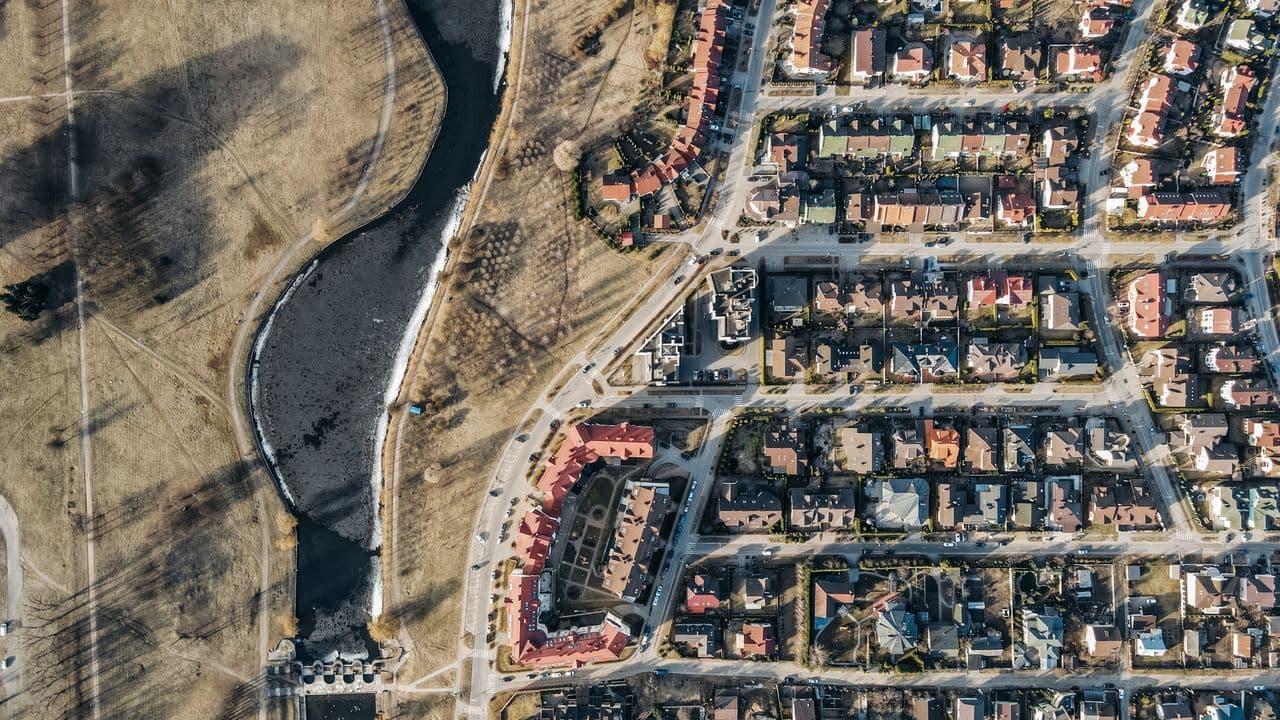
Start with the dated local finding: Clovis, CA's current ACS housing baseline includes 43,691 total housing units, 42,071 occupied units, and 1,620 vacant units. In practical terms, those counts may help a borrower establish the scale of the measured housing base before comparing tenure, rent, current listings, property condition, and financing. The figures describe stock across the survey period; they do not say that 1,620 homes were listed for sale or available to rent at one moment. For the decision at hand, reading 43,691 total units with 42,071 occupied and 1,620 vacant units keeps the release internally grounded while leaving live availability to current listing and property evidence.
A grounded Clovis, CA comparison starts with current listings and lease offers, then uses the ACS evidence to check whether the sample is being interpreted in the context of 43,691 total units, a vacancy share of 3.7%, and an owner share of 65.4%. On the rental side, replace the $1,792 median with the actual lease, utilities, deposits, and expected changes. For ownership, keep the 65.4% share as market context while adding the selected property's price, taxes, insurance, maintenance, association obligations, loan disclosures, and cash-to-close. For borrower planning, the resulting worksheet will not turn 34.6% or 65.4% into a recommendation, but it will keep the two paths comparable and make the remaining assumptions visible before a decision.